Lewius Gordon

Rashi Sawant

UX Strategist

background
avatar

Rashi Sawant

UX Strategist

Hi! I'm Rashi Sawant, a UX Strategist blending cognitive science, psychology, and business to research, strategize, and design for human behavior.

Based in

NYC, NJ, Philly

var(--variable-dmIeCVzE2)

LXRInsights - NetElixir

CLIENT

NetElixir

YEAR

Jun 2025 - Aug 2025

INDUSTRY

E-Commerce & Marketing

SERVICES

Professional Projects

Key Highlights

About the Product

Design a clearer, more intuitive dashboard experience that helps users navigate information, understand tools, and complete core tasks with greater ease. The objective was to create a more cohesive system through improved hierarchy, structured information, and purposeful interactions.

Problem Statement

LXRInsights’ dashboard made core tasks harder than they should be. Inconsistent timelines, weak visual hierarchy, unclear labels, and fragmented layouts created friction for users, which revealed the need for a more intuitive, research-driven UX.

Objectives

Simplify onboarding for experiments and other tools, and build a consistent, scalable visual system for future features

Impact

Usability testing revealed a 37% decrease in task completion time from ~8 minutes to ~5 after our changes, in addition to higher ratings of user confidence in other pages.

Role

Lead UX Designer

Platform

Desktop

Process

Initial UX Audit - Previous Dashboard
var(--variable-dmIeCVzE2)

Original dashboard pictured. Each team member conducted an independent UX audit to identify key strengths and usability issues across the platform, bringing diverse perspectives into the evaluation.

Stakeholder & Background Research

I led stakeholder interviews to align business goals, priorities, and design direction while uncovering key constraints and opportunities that informed product decisions.

var(--variable-dmIeCVzE2)
Wireframing & Prototyping - New Dashboard
var(--variable-dmIeCVzE2)

Redesigned and standardized the platform’s visual system across core pages to create a cleaner, more cohesive experience. Improved onboarding & info architecture in Experiments, aligned Audience Manager and Predictions with updated structural patterns, optimized analytics for quick insights and deeper data exploration, and established scalable layouts for future tools and features.

User Testing & Iterations

I led user testing on our prototypes to compare user feedback across different frames and interactions, identifying which design changes were most effective and which required further refinement. We also measured task completion rates, observing an improvement from approximately 8 minutes to 5 minutes, indicating increased usability and efficiency.

var(--variable-dmIeCVzE2)

Design

Overview Page

Original Layout

var(--variable-dmIeCVzE2)

Proposed Design

var(--variable-dmIeCVzE2)

Organized Hierarchy

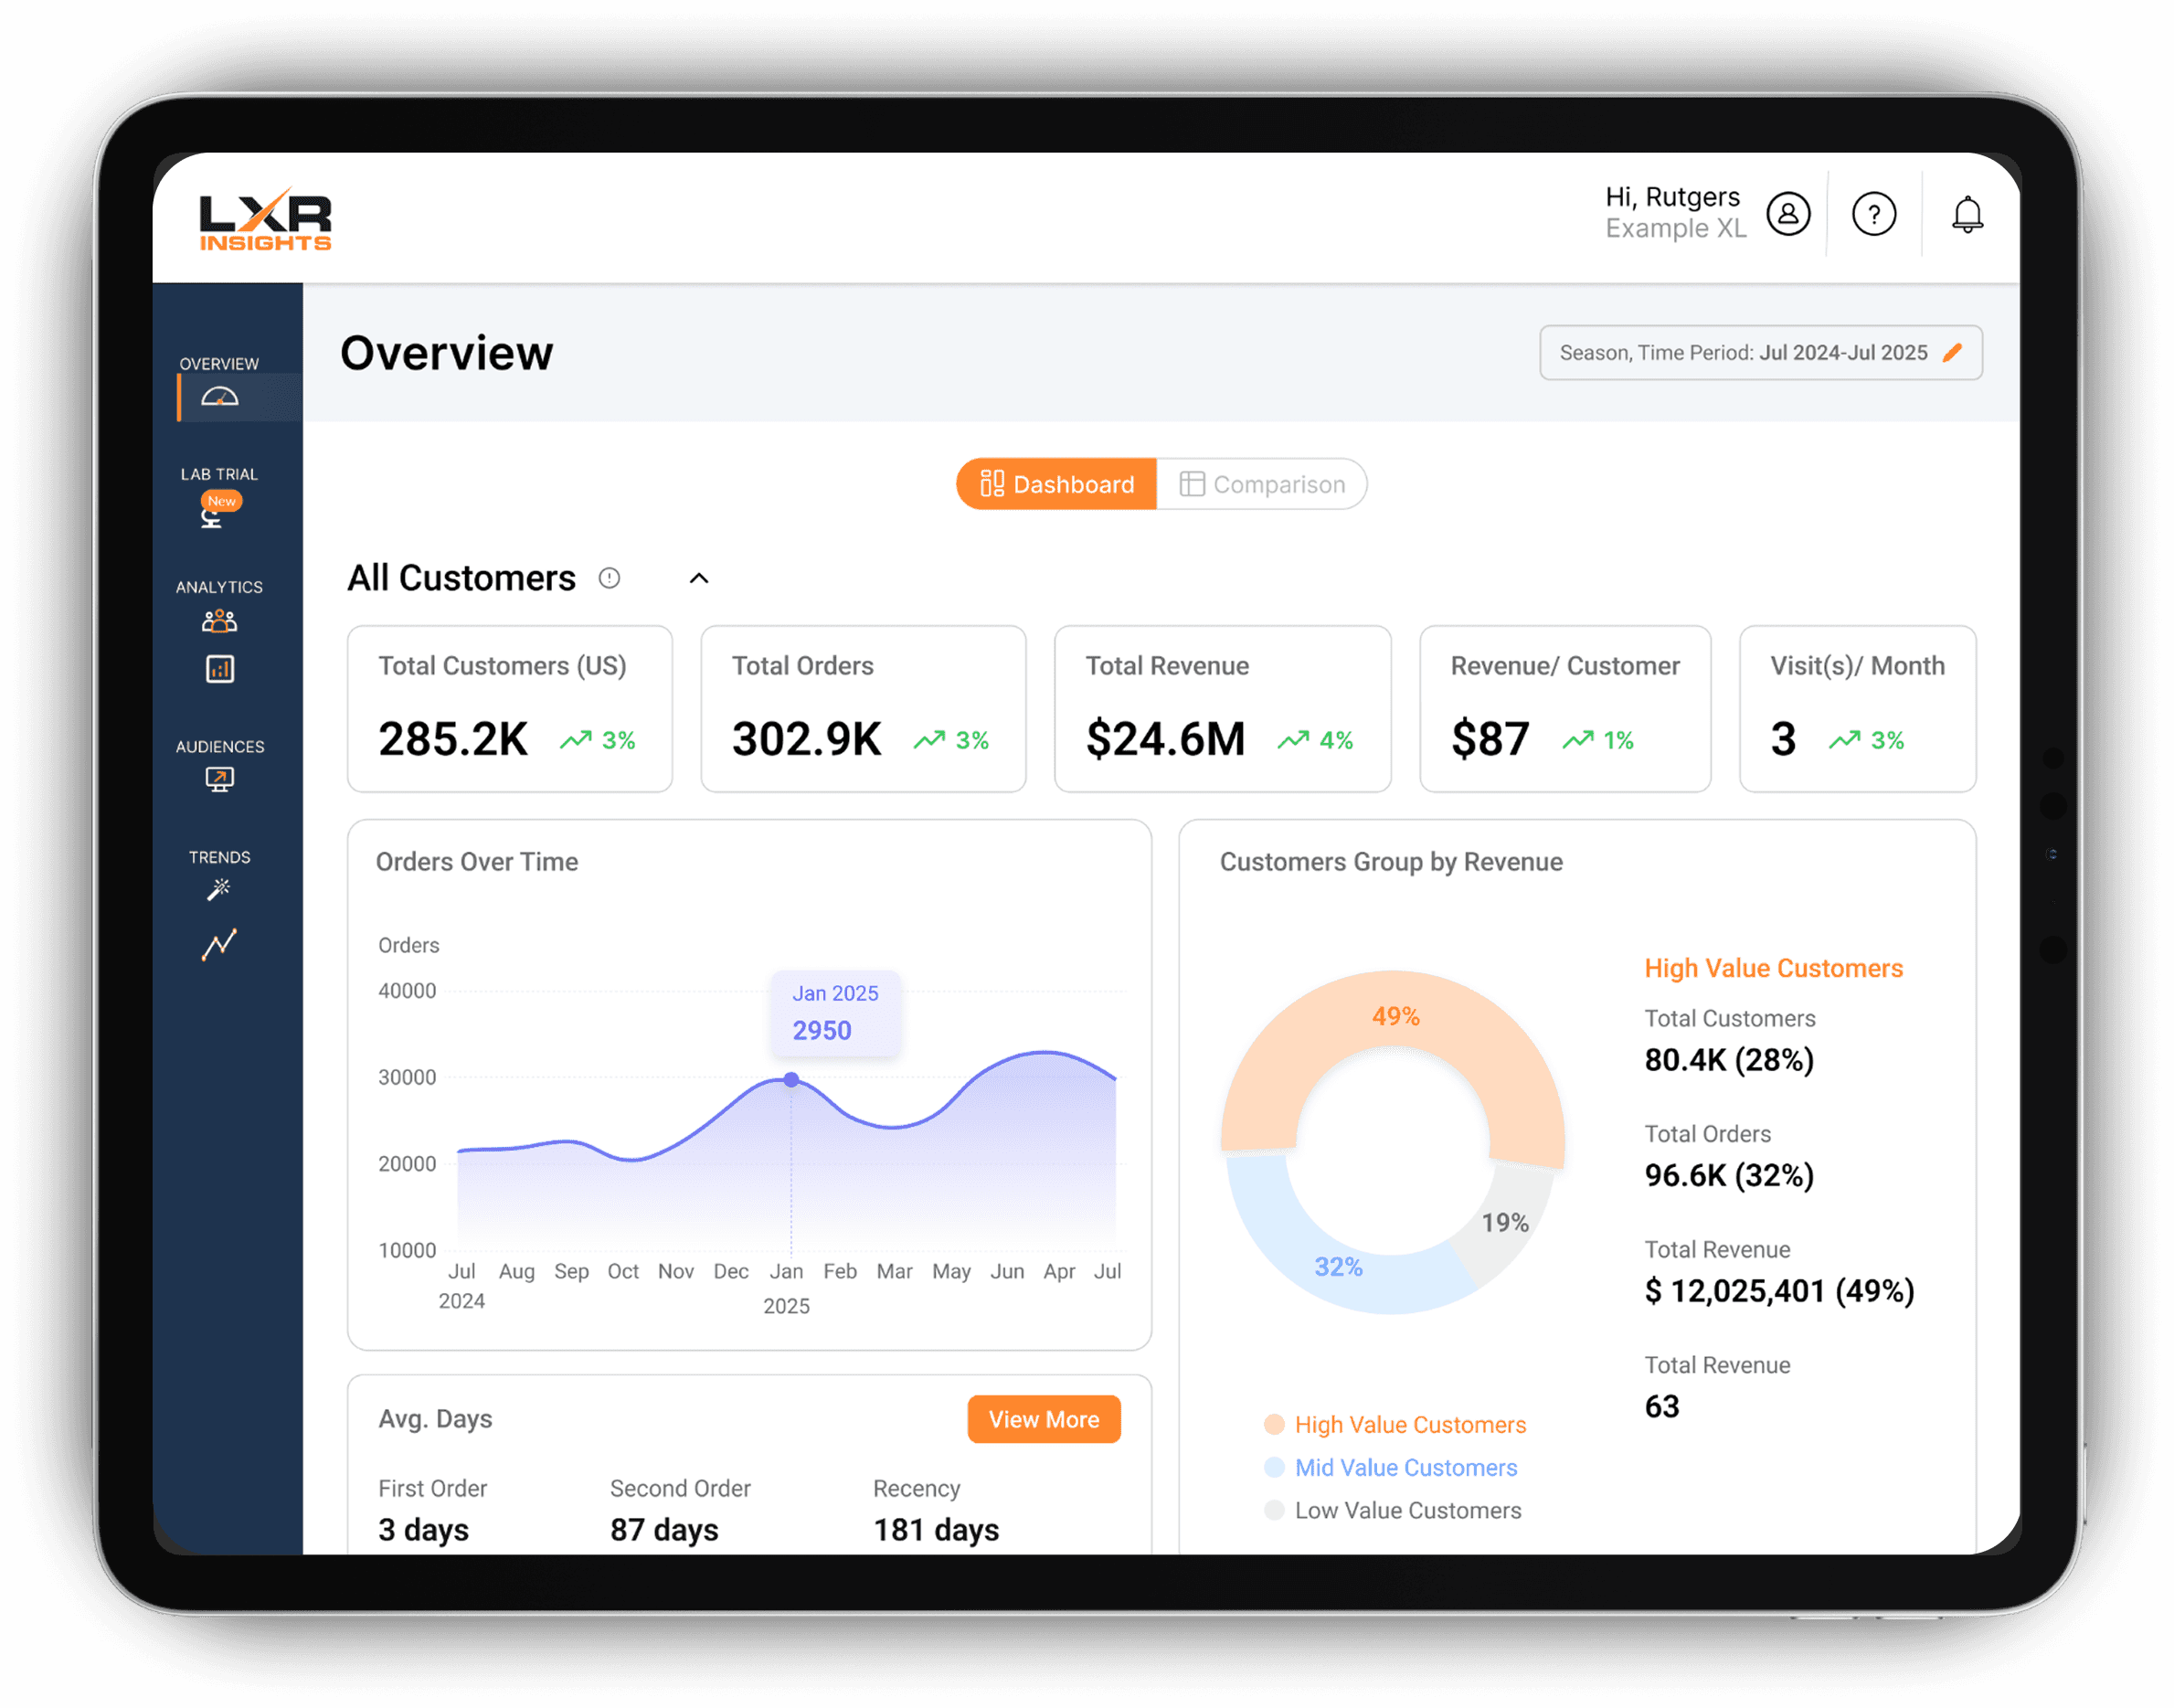
Enhanced visual hierarchy and information architecture to standardize content, clarify CTAs, and improve usability through a collapsible accordion layout for secondary information.

Increased Usability

Enabled flexible date-based data exploration through an integrated timeline/date picker, supported by backend logic for dynamic filtering and retrieval across selected date ranges.

Visual Design

Improved navigation and visual hierarchy by elevating Dashboard vs. Comparison page toggles, reinforcing customer segment color coding, and replacing gradients with a clearer visual system.

Experiments Page

Original Layout

var(--variable-dmIeCVzE2)

Proposed Design

var(--variable-dmIeCVzE2)

Simplified Onboarding

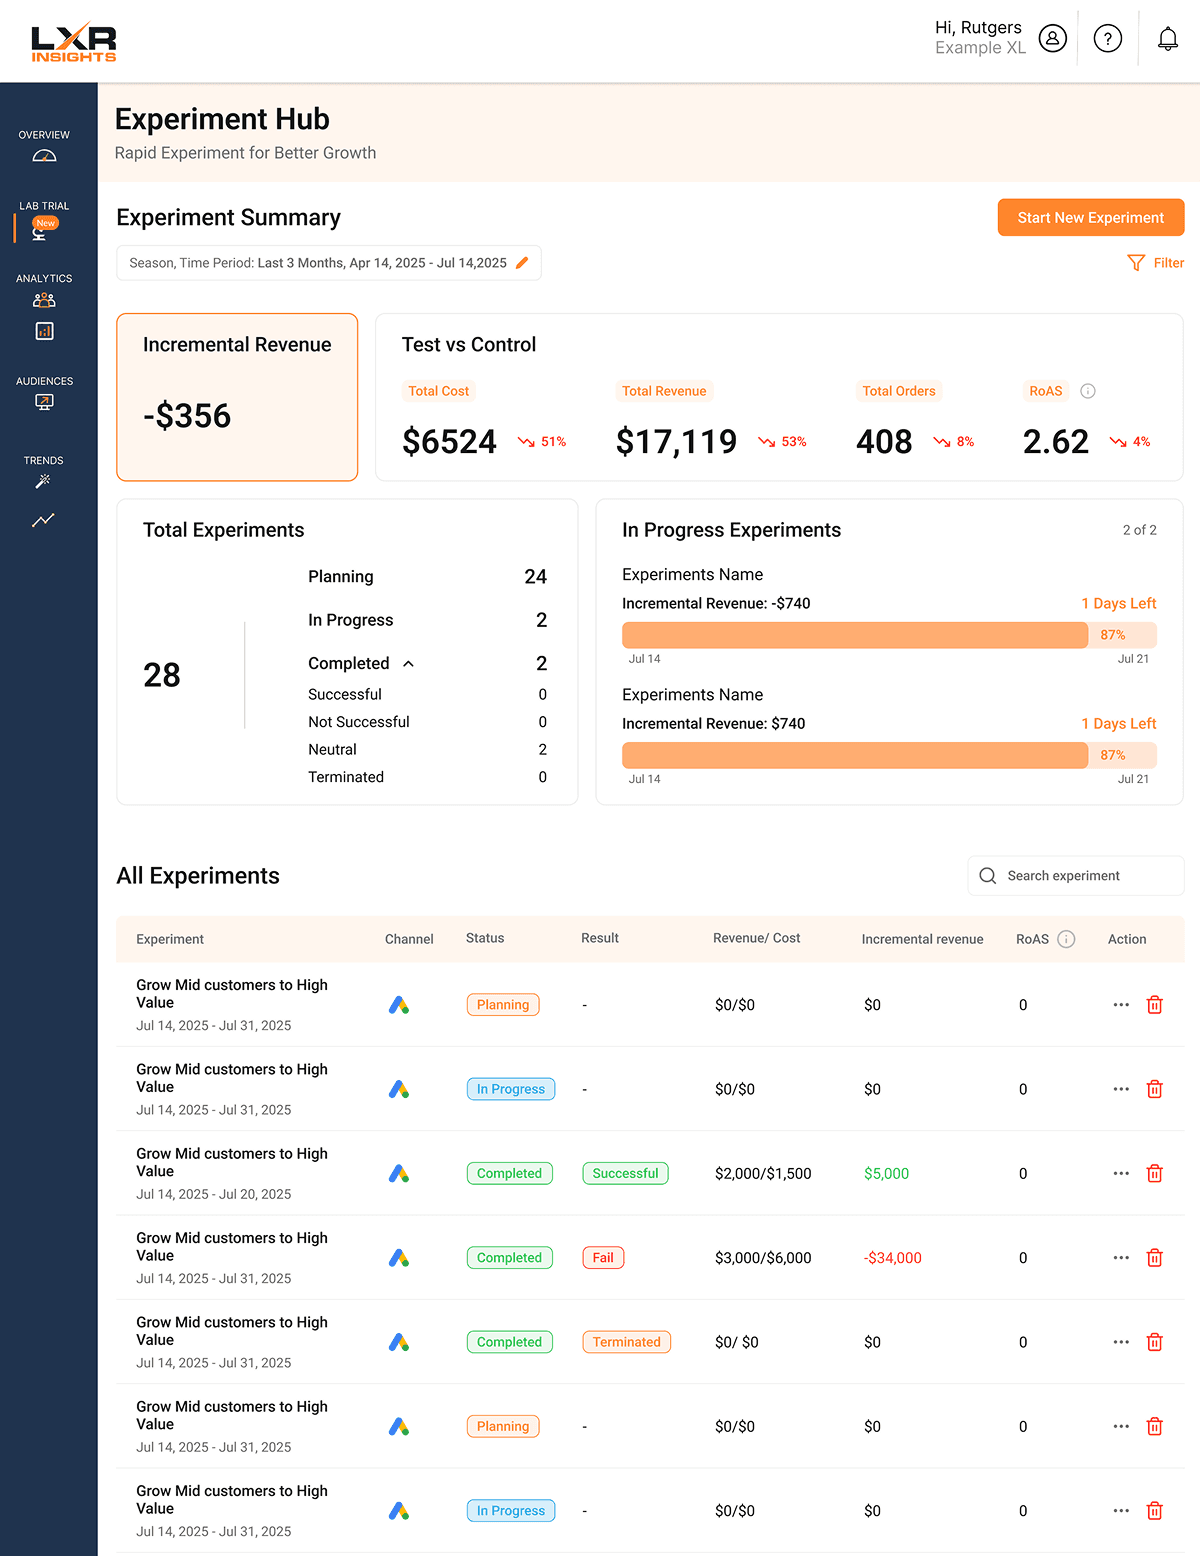
Redesigned the “Start New Experiments” flow using progressive disclosure, reducing task completion time by 37% through validated user testing.

Streamlined Reporting & Insights

Streamlined experiment reporting by consolidating completed experiment views and introducing In-Progress Experiments and Key Insights for improved tracking and visibility.

Enhanced Visuals & Interaction

Modernized data visualization and workflows by redesigning line charts, introducing status/result tags, and adding an action row to streamline user interactions.

Predictions Page

Original Layout

var(--variable-dmIeCVzE2)

Proposed Design

var(--variable-dmIeCVzE2)

Information Architecture

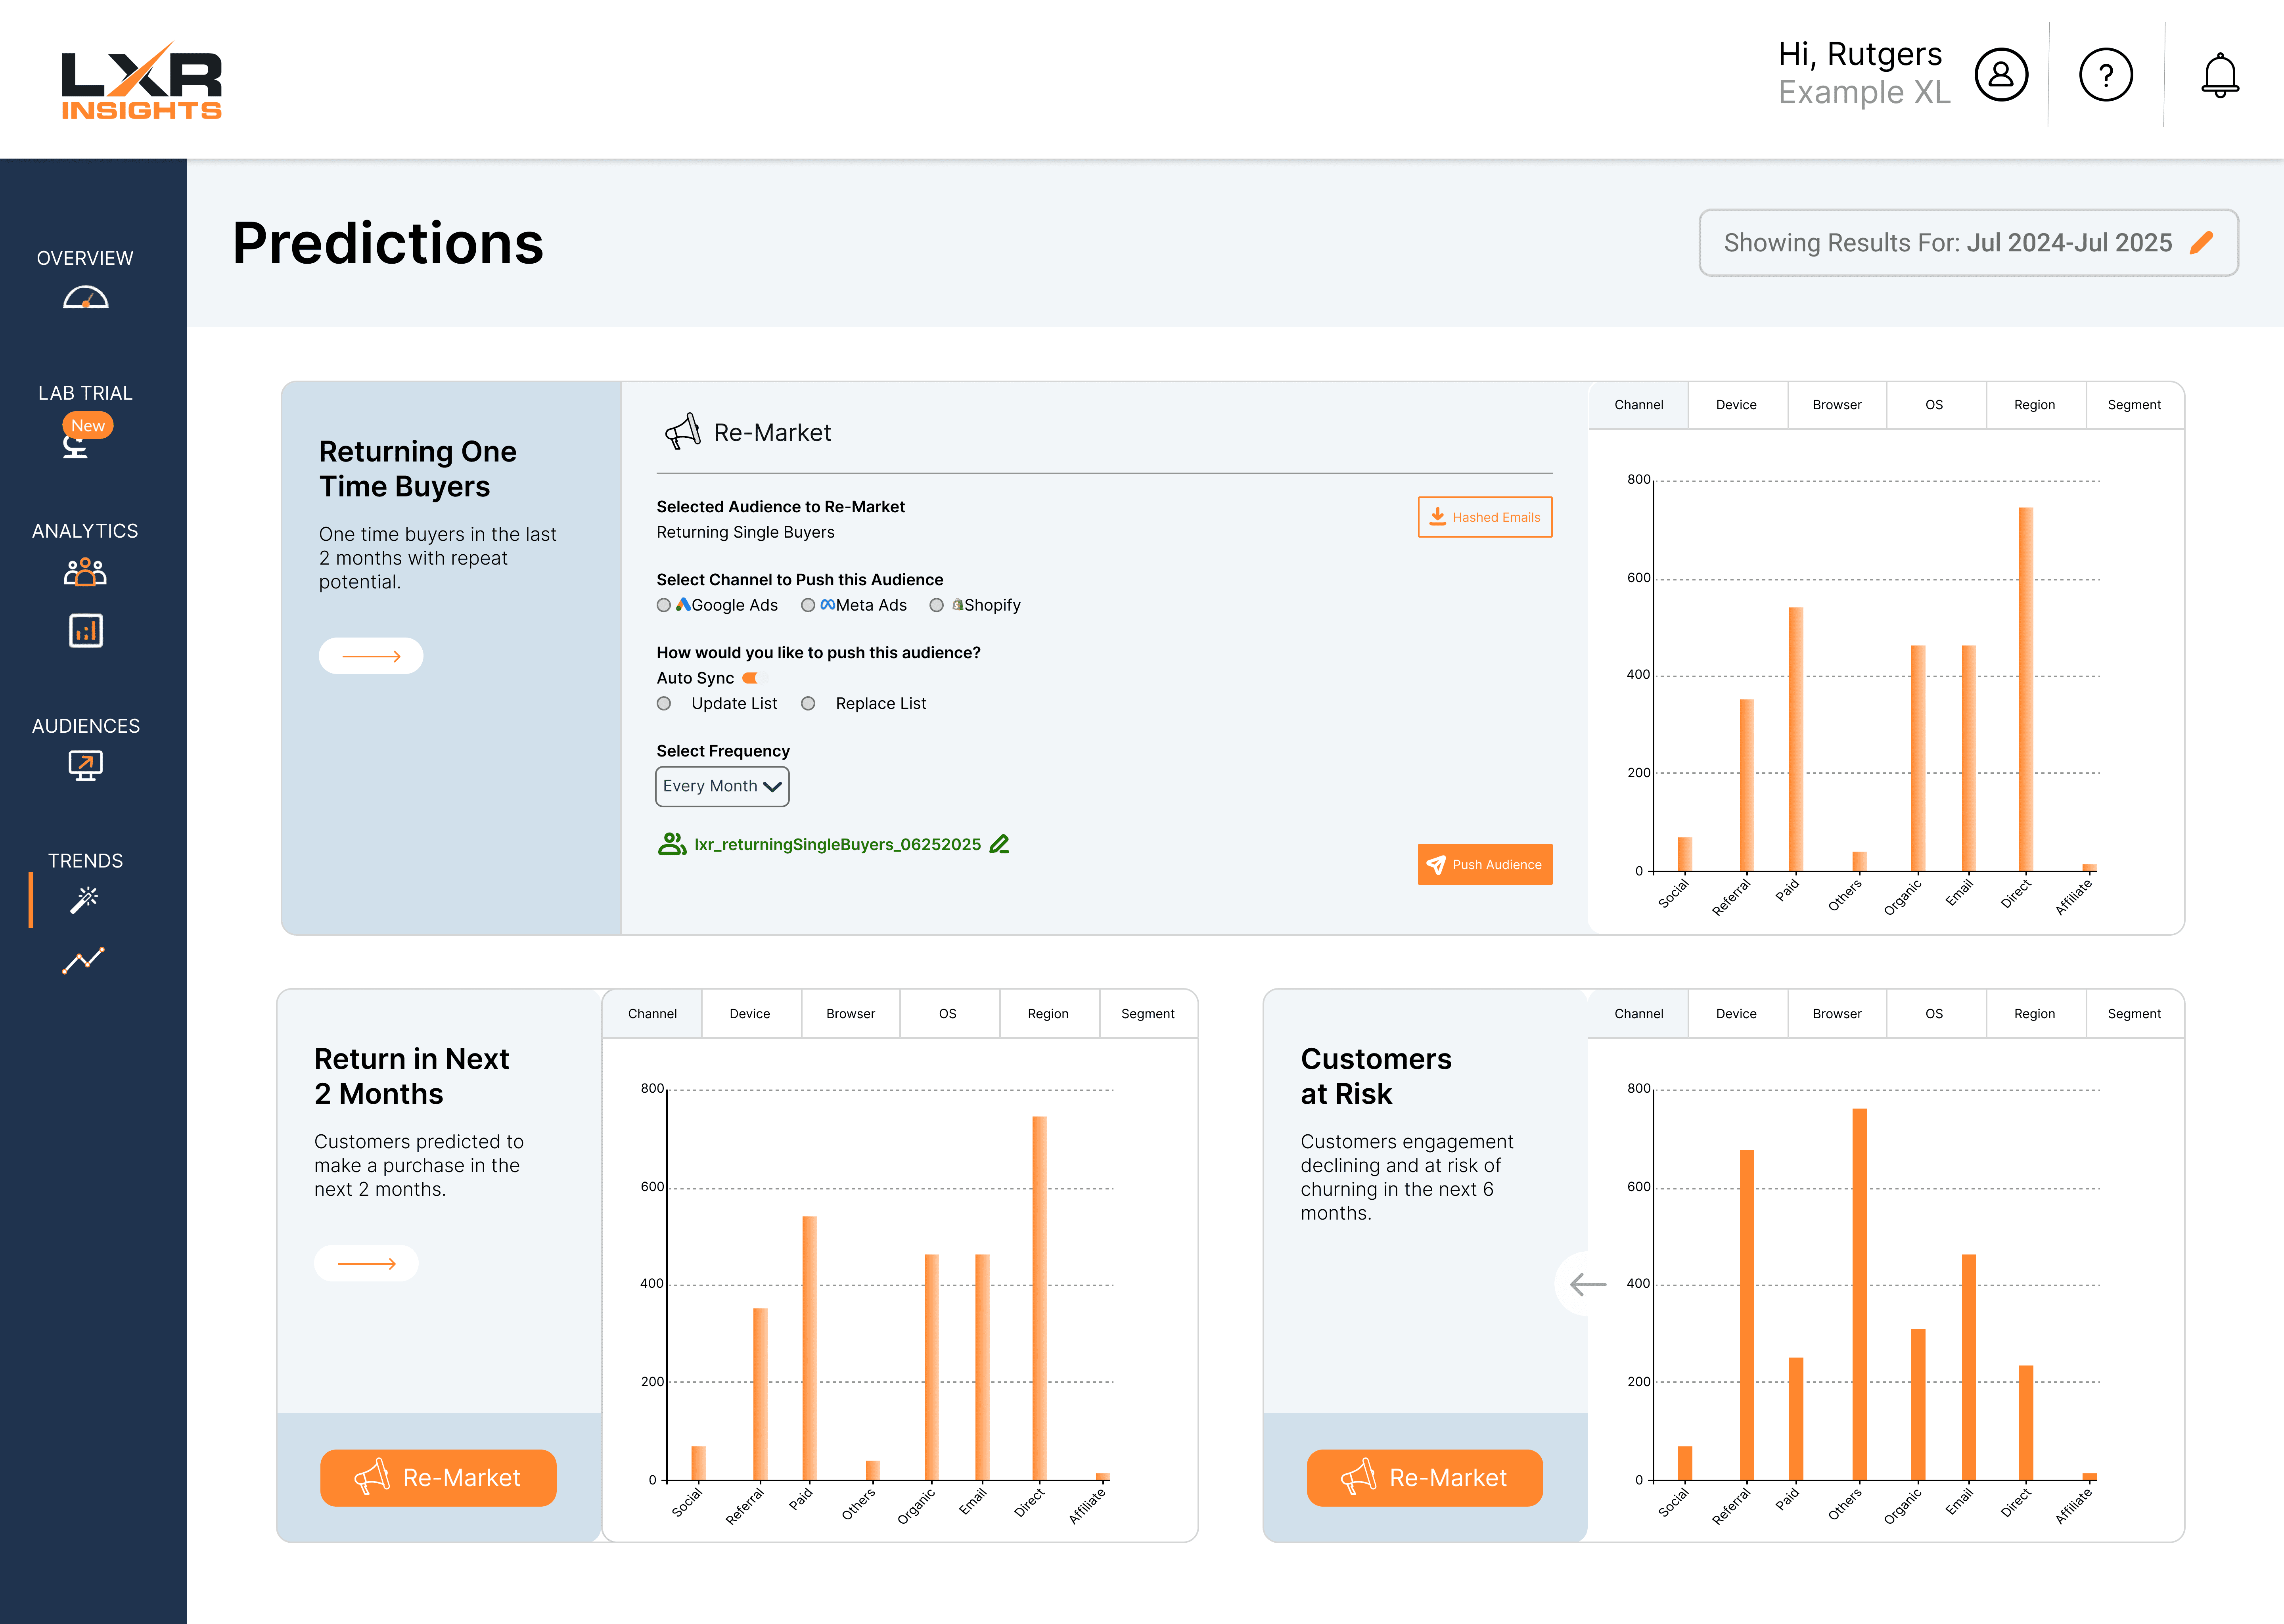
Redesigned the data layout using structured flows and accordion components to support both quick scanning and deeper exploration of information.

Unified Visuals

Aligned visual patterns, typography, and structure with the product design system while optimizing a scalable three-section layout with two color options.

Interaction & Usability

Integrated “Re-Market” into information containers instead of side pop-out page, improved graph labeling, and tested color and interaction styles to enhance usability.

Final Steps

Final Steps & Takeaways

User interviews ran in two rounds of 5, with a second session midway to validate early design directions. For user testing, 10 participants measured task completion time and satisfaction across qualitative and quantitative metrics. I led a final cross-functional meeting to present research, data, and prototypes while organizing all files and documentation for the client's continued use.

Explore More Works

var(--variable-pZqL61UMU)